


This article explains how to choose between PCA and t-SNE for visualizing complex data. You will learn the pros and cons of each method. We also show you how to use them together with Python code.
We will cover:
- The main ideas, strengths, and weaknesses of PCA and t-SNE.
- When to use each tool, and when to use both.
- A simple workflow using PCA then t-SNE with scikit-learn.
Let\'s begin.

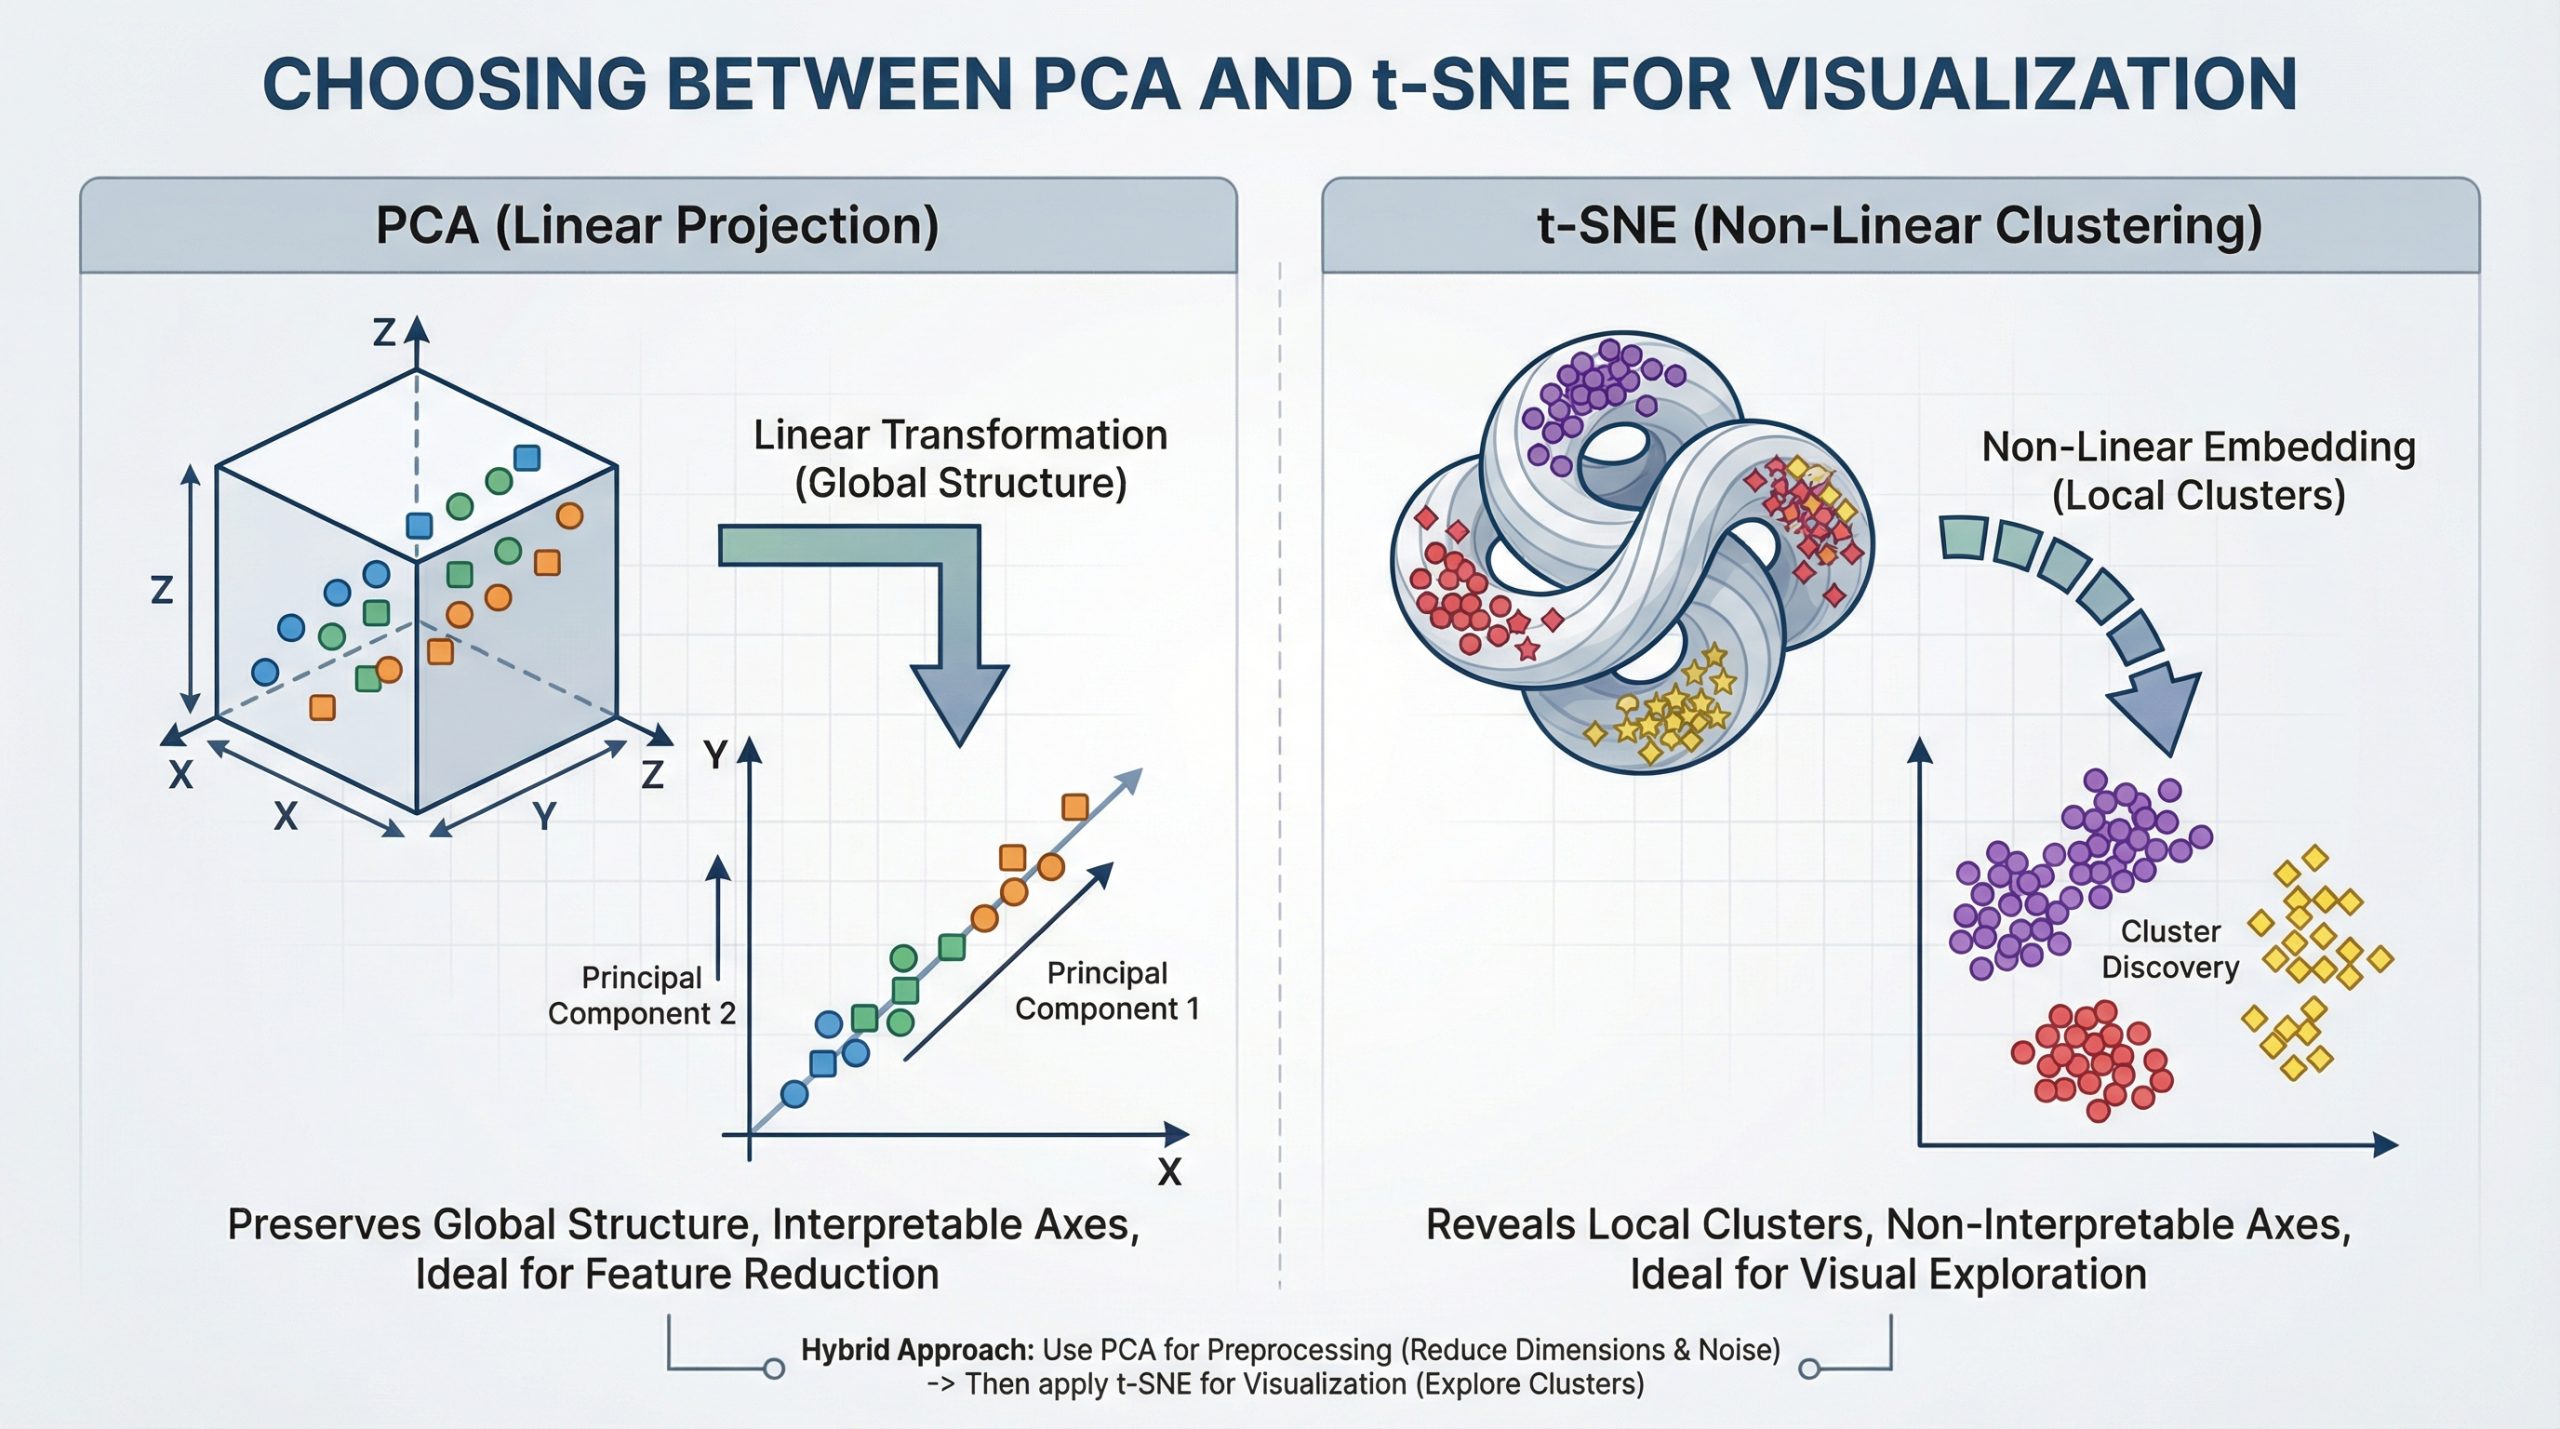
Data scientists often work with data that has many variables. This data can be hard to visualize. Dimensionality reduction helps make this data easier to understand. PCA and t-SNE are two popular methods for this task. They both reduce the number of variables, but they do it for different reasons.
What is Principal Component Analysis (PCA)?
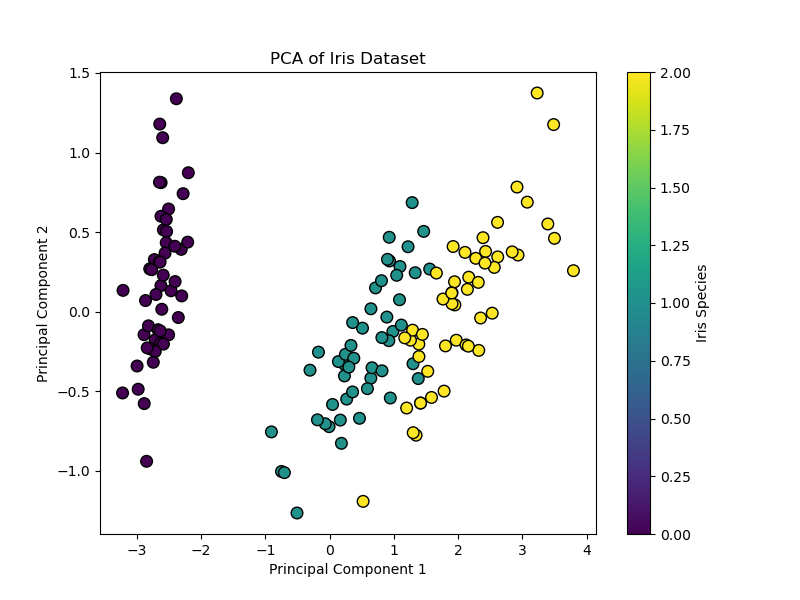
PCA is a method that changes your data into new axes. These are called principal components. PCA finds new axes that show the biggest differences in your data. The first axis shows the most difference. The next axis shows the second most difference, and so on. PCA does this by looking at the data's spread. It’s like rotating your data to find the best view that shows the most information.
When to Use PCA
- Reduce the number of features before using machine learning models.
- Remove noise from your data.
- Make model training faster.
- Understand the main patterns in your data.
PCA with Scikit-Learn in Python
Using PCA in Python is simple. The n_components setting tells PCA how many dimensions to create. This code example shows how to reduce the Iris dataset to 2 dimensions. It uses PCA to find the directions of greatest variance. The explained_variance_ratio_ shows how much information was kept.
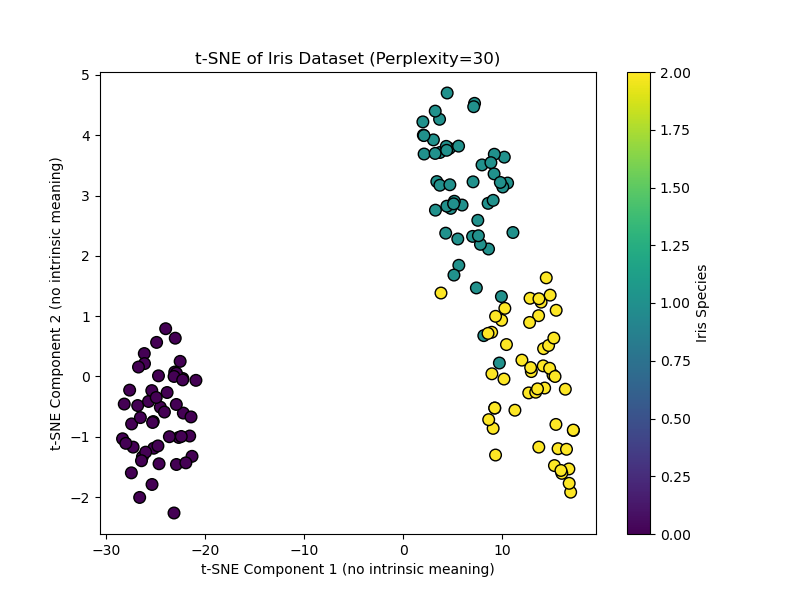
What is t-Distributed Stochastic Neighbor Embedding (t-SNE)?
t-SNE is a method used mostly for visualization. It creates a low-dimensional map (2D or 3D) of your data. It tries to keep points that are close together in the original data close together in the new map. t-SNE is good at finding groups of similar data points, called clusters. These clusters might be hard to see with PCA.
When to Use t-SNE
- Explore and visualize clusters in your data.
- See hidden patterns in complex data.
- Visualize embeddings, like word meanings.
Important Limits of t-SNE
- The axes in a t-SNE plot don\'t have a clear meaning. Only how points group together matters.
- You cannot compare clusters between different t-SNE plots.
- The
perplexitysetting is very important. You need to test different values.
t-SNE with Scikit-Learn in Python
This code creates a t-SNE visualization. It uses PCA to start the process, which helps make the results more stable. The plot shows how t-SNE groups similar points. Remember, the axes have no real meaning.
A Combined Approach: PCA then t-SNE
A common and effective method is to use PCA first, then t-SNE. This uses the best parts of both methods:
- Use PCA to reduce very large datasets (like 1000+ features) to a smaller number (like 50 features). This removes noise and makes t-SNE run much faster.
- Then, use t-SNE on the reduced data from PCA to create a final 2D visualization.
Why use PCA before t-SNE?
This combined method helps t-SNE run faster and creates more stable results. It is a good way to visualize complex data.
Conclusion
Choose your tool based on your goal:
- Use PCA for general data reduction, cleaning data, or preparing data for machine learning models. It helps you see the main structure of your data.
- Use t-SNE when you want to explore data visually and find clusters. Be ready to adjust settings and do not try to understand the plot axes too deeply.
Start with PCA. If it shows clear patterns, it might be enough. If you think there are hidden groups, try t-SNE or the combined PCA-t-SNE method.
There are also newer methods like UMAP. UMAP is often faster than t-SNE. It also keeps more of the data\'s overall structure. UMAP is now a popular choice for visualization.
We hope this guide helps you choose between PCA and t-SNE. The best way to learn is to try both methods on your own data. See how they show your data in different ways.
References
- Scikit-learn PCA Documentation
- Scikit-learn t-SNE Documentation
- Original t-SNE Paper – van der Maaten & Hinton
- PCA Explanation – Wikipedia
- t-SNE Visual Guide
- UMAP Documentation